Breadth and Forward Returns
A look at the local minima from Thursday, July 30, 2026
By mak ·
Some market participants saw volatile sessions in the past two weeks, while others saw relative calmness as the S&P sat within all time highs. Of course if you’ve been following the AI trade (and exposed to it), you’d know the volatility I’m talking about.
Last Thursday seemed to have marked a local minima as there was a large rebound in both the Nasdaq and S&P, after a protracted downtrend in tech. This of course coincided with the liquidation of Situational Awareness’s public portfolio.
What was interesting for me was when you look at the breadth of the market (S&P) vs historical daily returns, it produces a nice sigmoid function that seems to be reasonably correlated. This makes sense of course as a market index typically needs its constituents to rise for it to also rise.
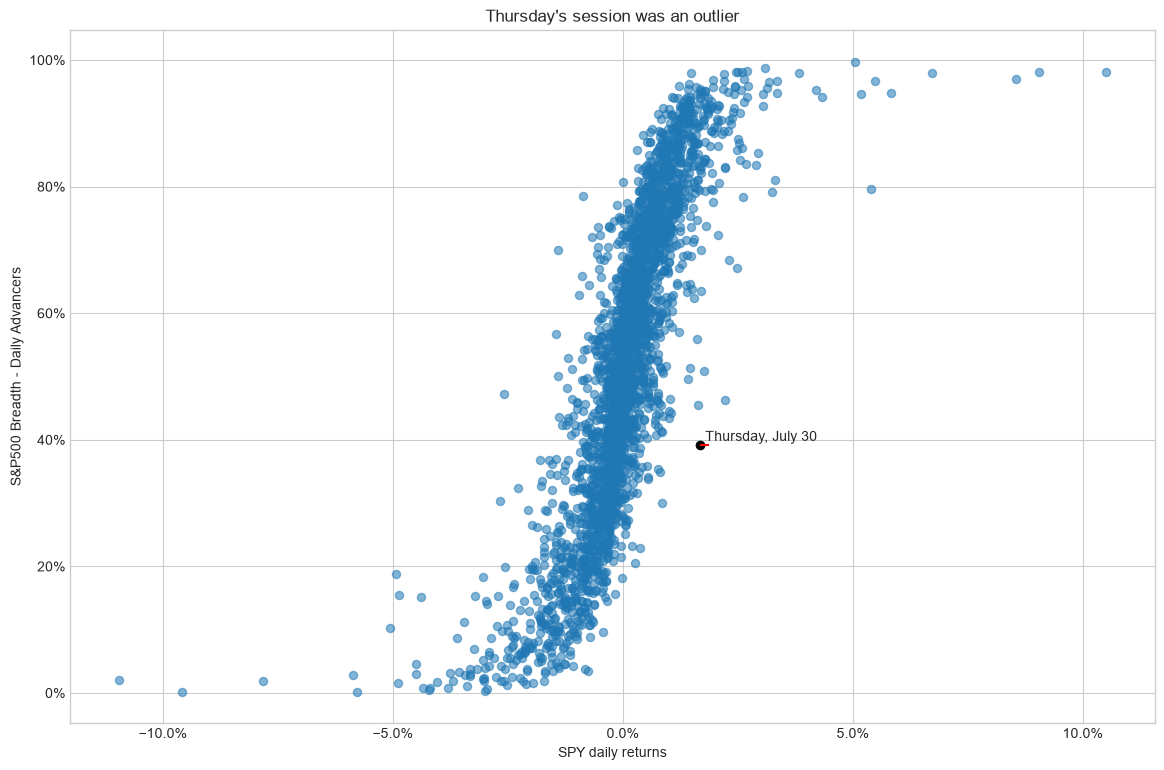
Thursday’s session stood out: a lone dot with under 40% breadth but well over the expected return for a market breadth of that magnitude. This basically means that most of the market upward push was driven by a small sample of stocks.
But does this really mean anything? I thought it might so I took a look at forward returns after specific cases where the market breadth was below 40% and return on the day was greater than or equal to 0.
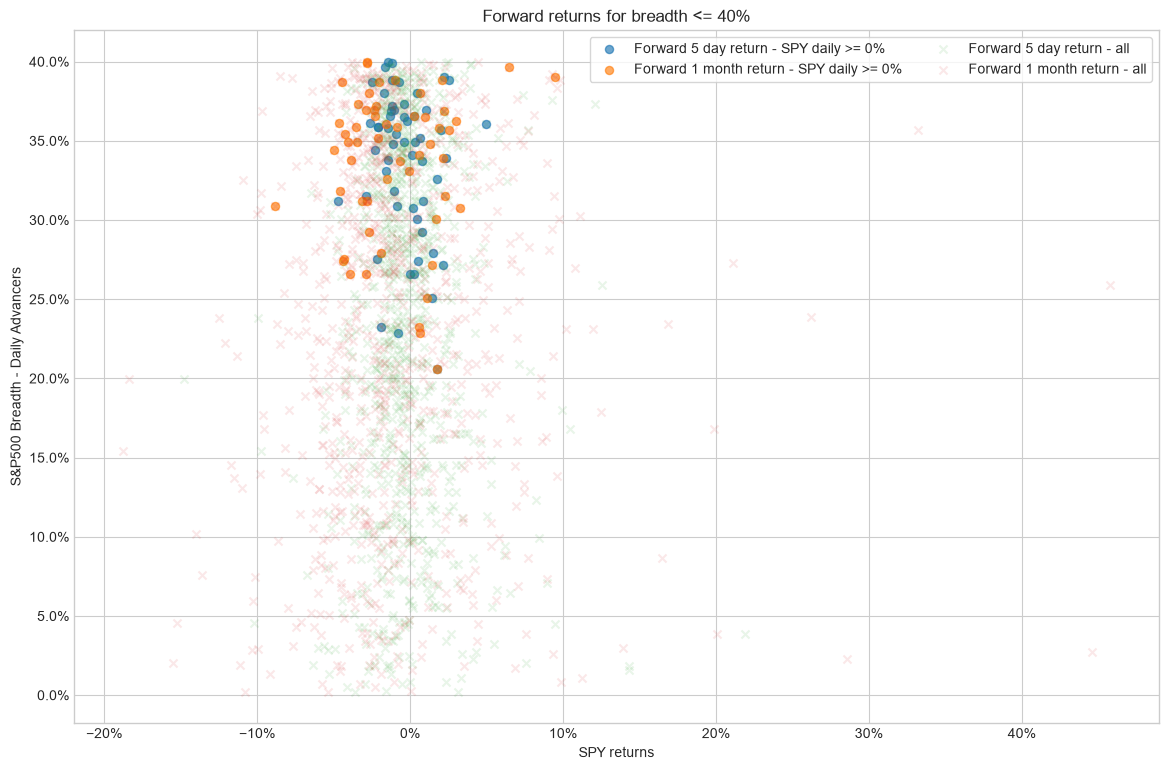
Turns out, it doesn’t really mean much directionally, but returns 5 and 20 days out are relatively bunched around 0. There also seems to be a slight negative correlation between the market breadth and 5 day forward return.
Interesting?